Aquaponics Monitoring with Cacti
Setting up the Raspberry Pi
This is a very versatile kit, and it is really as easy as following the instructions, screwing the kit together (without the Tentacle Board), plug in a keyboard, mouse, and monitor, and turning it on.
It will boot into a nice GUI of Linux.


Linux raspberrypi 5.10.17-v7l+ #1421
I highly recommend that you DO NOT use wifi, this I just a personal preference, but when I am running monitoring software I want to be able to guarantee connectivity, so always use Ethernet.
Altas Scientific
Monitoring helps to provide a good record of where you have been, how your system is responding to various conditions, and give early visual warning to potential issues.
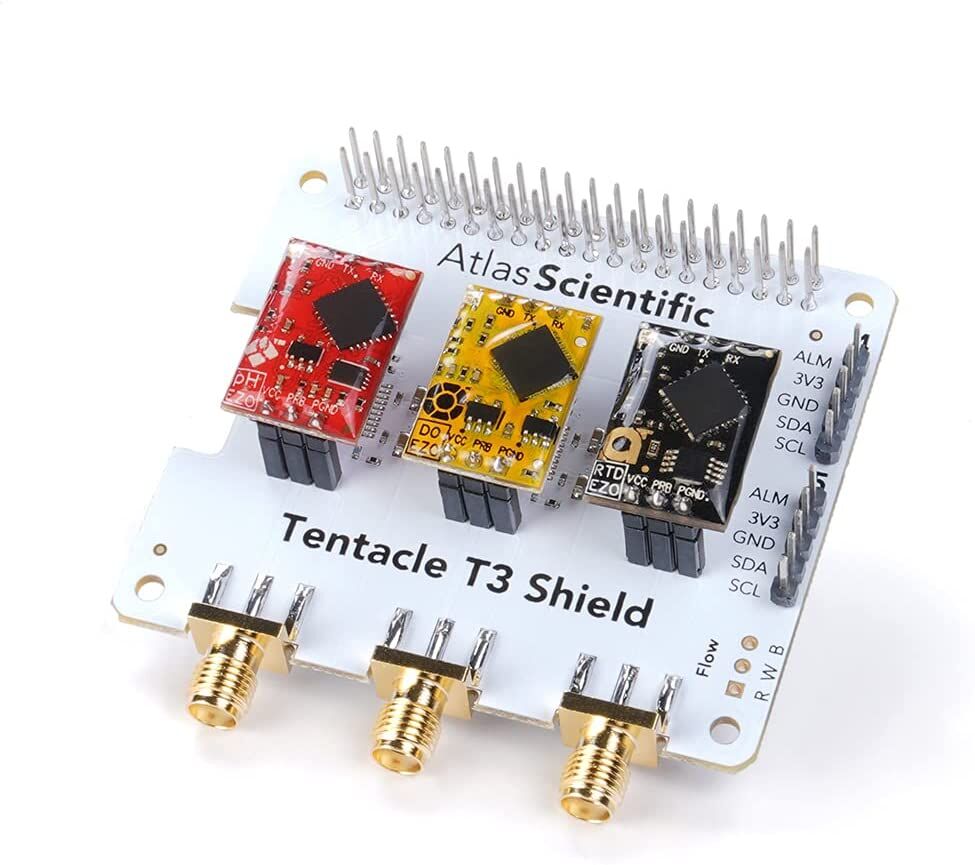
We are using a Raspberry Pi from CanaKit, this Tentacle T3 add-on board from Atlas Scientific, and three probes.
You can stack three Tentacle Boards on top of each other for a total of nine probes.
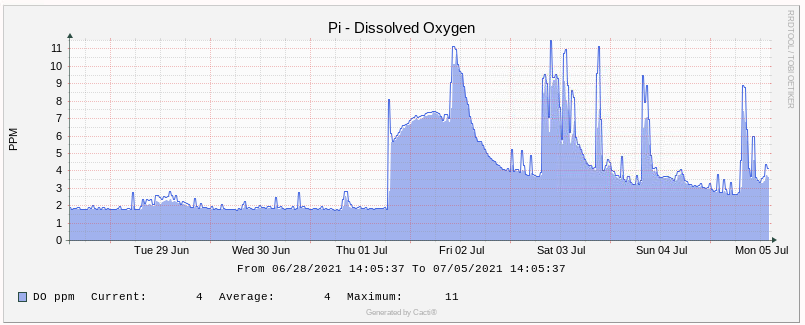
You can see our graphs here.
I highly recommend that you DO NOT use wifi, this I just a personal preference, but when I am running monitoring software I want to be able to guarantee connectivity, so always use ethernet.
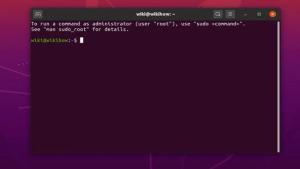
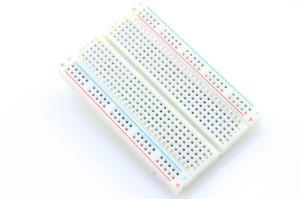
You will need to learn how to use the Linux Terminal as well as a Breadboard.
PT-1000 Temperature Probe

Live to Campus guest:guest
You can see the temperature cycling through the day. This pond is fully shaded and contains between one hundred to three hundred fish.
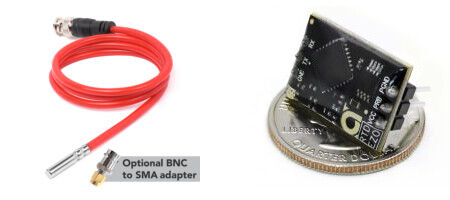
PT-1000 Temperature Probe
It will plug directly into the Tentacle Board. You will also need the EZO™ RTD Temperature Circuit that plugs into the Tentacle, which enables you to read the specific signal coming off this probe. Each probe needs a corresponding EZO Circuit.
Mini Lab Grade pH Probe
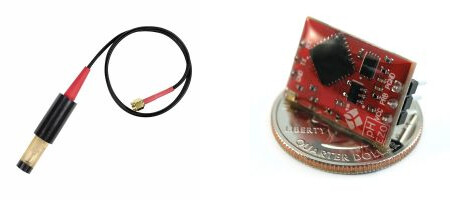
Mini Lab Grade pH Probe
This probe comes with a rather short cable that necessitated us buying one of these.
It will plug directly into the Tentacle Board. You will also need the EZO™ pH Circuit that plugs into the Tentacle, which enables you to read the specific signal coming off this probe. Each probe needs a corresponding EZO Circuit.
Mini Lab Grade Dissolved Oxygen Probe
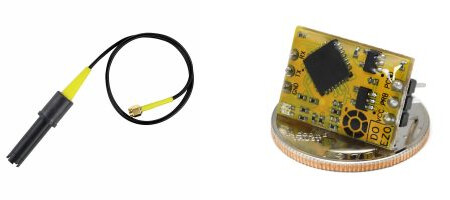
Mini Lab Grade Dissolved Oxygen Probe
Designed for small spaces, this small probe gives you the same quality readings found in our lab-grade Dissolved Oxygen just smaller. Because smaller probes use fewer precious metals, we can get the price lower. Keep in mind; smaller probes hold less electrolyte. Because of this, they need to be refilled more frequently than full-size or industrial probes. Each probe needs a corresponding EZO Circuit.
PT-1000 Temperature Probe
Mini Lab Grade pH Probe

Calibrating Probes.
- Out of the box, the probes do need calibration.
- If you put an extension cable on the probes they will need calibration.
- Over time the probes need to be re-calibrated.
Temperature.
Boil a jug of water to 100c.
Calibrate the probe to this temperature.
You can buy one-time solutions to re-calibrate the pH and DO probes.
pH.
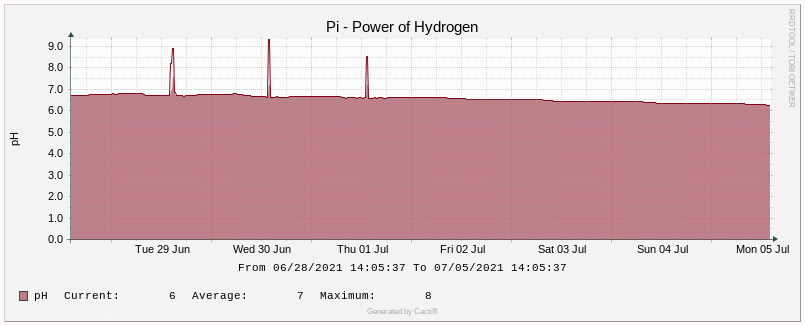
We have re-calibrated the pH probe by using normal tap water, getting a reading using pH test solution, and seeing a pH of 7. This gave us the mid-bound reading. We then used the test solution and got a reading from a tank that was a pH of 4. This gave us a low-bound reading.
Dissolved Oxygen.
Taking the probe out of the water, with or without an extension cable. You can interrogate the probe and when the numbers settle down to a constant, then you can generally know you are getting a reading of 8 ppm, and calibrate the probe to this setting.
Raspberry-Pi-sample-code
This is the current PDF for the python code from Atlas Scientific.
The command of interest is:
git clone https://github.com/AtlasScientific/Raspberry-Pi-sample-code.git |
This downloads the python code that we will be using to test the probes, calibrate them, and even change this code so we can use it with Cacti.
Once you have the code downloaded you can list the dir and see:
pi@raspberrypi:~/scripts/Raspberry-Pi-sample-code $ ls AtlasI2C.py AtlasI2C.pyc ftdi.py i2c.py LICENSE README.md readOrp.py uart.py |
When you run the main python program, you will see:
pi@raspberrypi:~/scripts/Raspberry-Pi-sample-code $ python i2c.py
>> Atlas Scientific I2C sample code
>> Any commands entered are passed to the default target device via I2C except:
  - Help
      brings up this menu
  - List
      lists the available I2C circuits.
      the --> indicates the target device that will receive individual commands
  - xxx:[command]
      sends the command to the device at I2C address xxx
      and sets future communications to that address
      Ex: "102:status" will send the command status to address 102
  - all:[command]
      sends the command to all devices
  - Poll[,x.xx]
      command continuously polls all devices
      the optional argument [,x.xx] lets you set a polling time
      where x.xx is greater than the minimum 1.50 second timeout.
      by default it will poll every 1.50 seconds
>> Pressing ctrl-c will stop the polling

--> DO 97
 - pH 99
 - RTD 102
>> Enter command:
|
You can see that we have three probes.
Temprature Calibration
- As an example, let’s say you have a pot of boiling water.
- You want to recalibrate the Temperature probe.
- You know the water is at 100 degrees celsius.
The command to enter, in our case is:
>> Enter command: 102:cal,100 |
And we will get back:
Success RTD 102: >> Enter command: |
And now we could run a new calibration.
pH Calibration
- We have a low reading of water at a pH of 4.
- We have a mid-reading of water at a pH of 7.
Clean off the probe.
Place in the mid-point solution.
Wait for the readings to stabilize.
The command to enter, in our case is:
>> Enter command: 99:cal,mid,7 |
And we will get back:
Success pH 99: >> Enter command: |
Clean off the probe.
Place in the low point solution.
Wait for the readings to stabilize.
The command to enter, in our case is:
>> Enter command: 99:cal,low,4 |
And we will get back:
Success pH 99: >> Enter command: |
The calibrations must be done mid, low, and high if you have a high.
Cacti Installed on a Raspberry Pi
Cacti
Cacti is a very programmable PHP-based Open Source monitoring system.
I have been using Cacti in a number of projects for over fifteen years.
It will receive inputs from standard protocols like SNMP, Simple Network Management Protocol, to home-brewed scripts in Bash, Perl, or Python, to importing customer plugins for Cisco, Tarango, and other manufacturers.
Using the python code provided by Atlas Scientific, we reworked their python code to integrate with Cacti.

Preperations
If you have just installed your Raspberry Pi there are a few things we need to make sure are installed.
Update to latest.
sudo apt-get update sudo apt-get upgrade |
This is for information and may change from when I installed it and you do.
Install Apache Web Server
sudo apt-get install apache2 |
Install SQL Database.
sudo apt-get install mariadb-server mariadb-client Welcome to the MariaDB monitor. Commands end with ; or \g. Copyright (c) 2000, 2018, Oracle, MariaDB Corporation Ab and others. Type ‘help;’ or ‘\h’ for help. Type ‘\c’ to clear the current input statement. MariaDB [(none)]> |
The current version as of April 2022 is 10.5.
Now for PHP. The current version is 7.4 as of April 2022.
sudo apt-get install php7.4 php7.4-mysql php7.4-snmp php7.4-gd php7.4-ldap rrdtool snmp snmpd -y |
Let’s test PHP.
Create the following file in /var/www/html/test.php
vi /var/www/html/test.php |
Open your browser and go to https://127.0.0.1/test.php
Make sure it is http and not https!
Hopefully, you will see the PHP info page, if you do all is good.
If you don’t something has failed.
This was my base document
https://community.spiceworks.com/how_to/105702-raspberrypi-how-to-install-cacti
Cacti Setup
Working with Linux and Cacti is a moving target.
If you are doing a new installation, please contact me if you would like some help and so I can update this documentation to reflect the process, now, at the end of 2021.
apt-get install cacti |
Answer yes to install.
Choose Apache as your webserver
Choose Yes to configure cacti
Choose a password for cacti
I use 4cacti
Let’s open cacti for the first time
the user is admin the password is 4cacti
Let’s create a monitor for this Raspberry Pi
Create -> New Device -> Description (some name) Hostname (127.0.0.1)
Go to Graphs -> Default Tree -> Machine -> Raspberry
And you will see the default graphs of
Setting Up Cacti to Receive Data from Probes
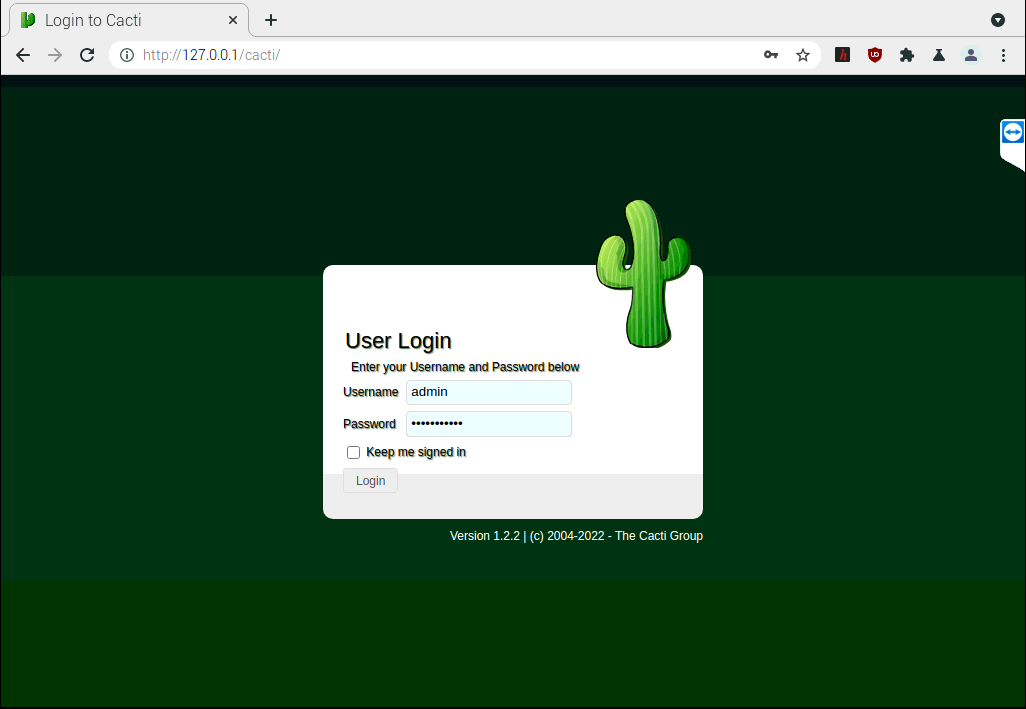
1. Login to Cacti
Generally, on a Raspberry Pi, go to http://127.0.0.1/cacti.
Notice that this is to http not https, there is more we could do to make your server signed and secure, but that is not part of what we are doing here.
Log in with your username and password.
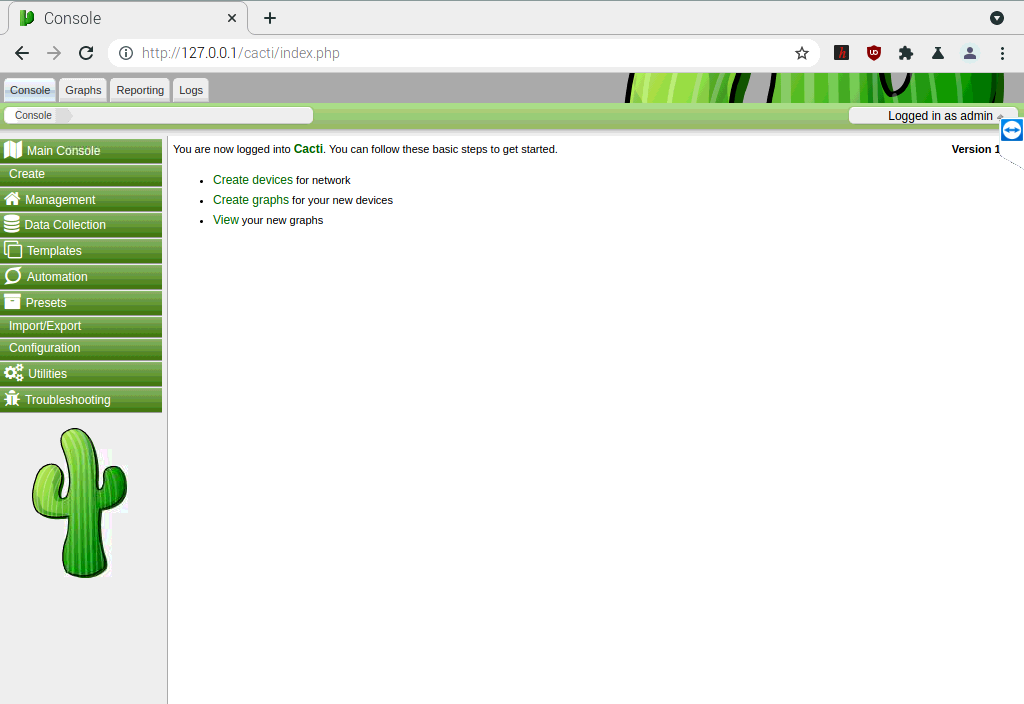
2. First Screen
Click on Graphs to see plots of what you are monitoring.
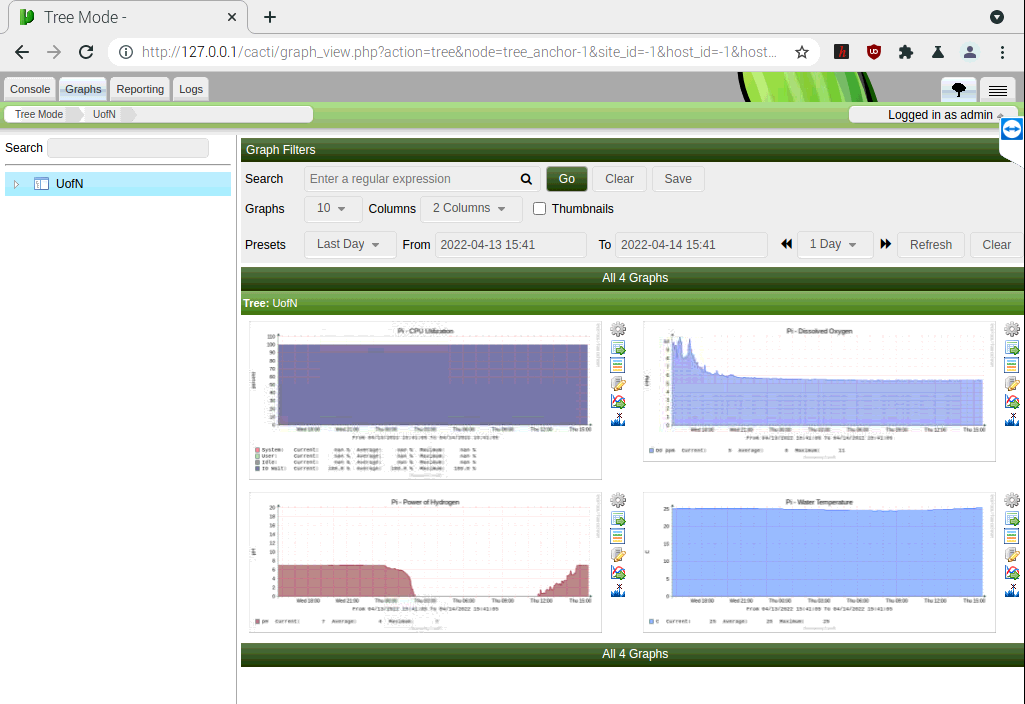
3. Graphs
The graphs show up in a tree, in my case I have the ones I want to look at at the root of the tree called UofN.
You can change them to be in one column or with a different date range.
In the example above we have the graphs, we have created for Cacti, plus one standard graph, CPU Utilization.
The three graphs we created from scratch are:
- Dissolved Oxygen,
- Power of Hydrogen and
- Water Temperature.

4. Console
Back at the console, we can Create -> New Graphs and New Devices.
You have to have a Device before you can have a Graph, and the Device you need to create first is for this Raspberry Pi.
So click on Create and click on New Device.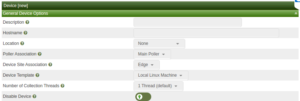
- You will need to fill out a Description, it can be whatever you like.
- Hostname is 127.0.0.1, as it is this device and this is the fastest way to get this device to respond. It could be a totally different IP address if you are getting information from a different location.
- Location can be ‘None’
- Poller Association is ‘Main Poller’
- Leave Device site Association as ‘Edge’
- Device Template is Local Linux Machine as the Raspberry Pi is a ‘Local Linux Machine’.
- Number of Collections Threads, leave as one, this will be more than enough.
- Then enable Device.
- Create
5. Collecting Data
In wanting to graph outputs from a Probe, we need the following:
- A Data Input Method.
How does the data come into Cacti - Data Source.
Pairing the data coming in with a ‘Holder’ for the data to be stored - Graph.
How the data will be displayed.
We will deal with Dissolved Oxygen to show all these parts connect together.
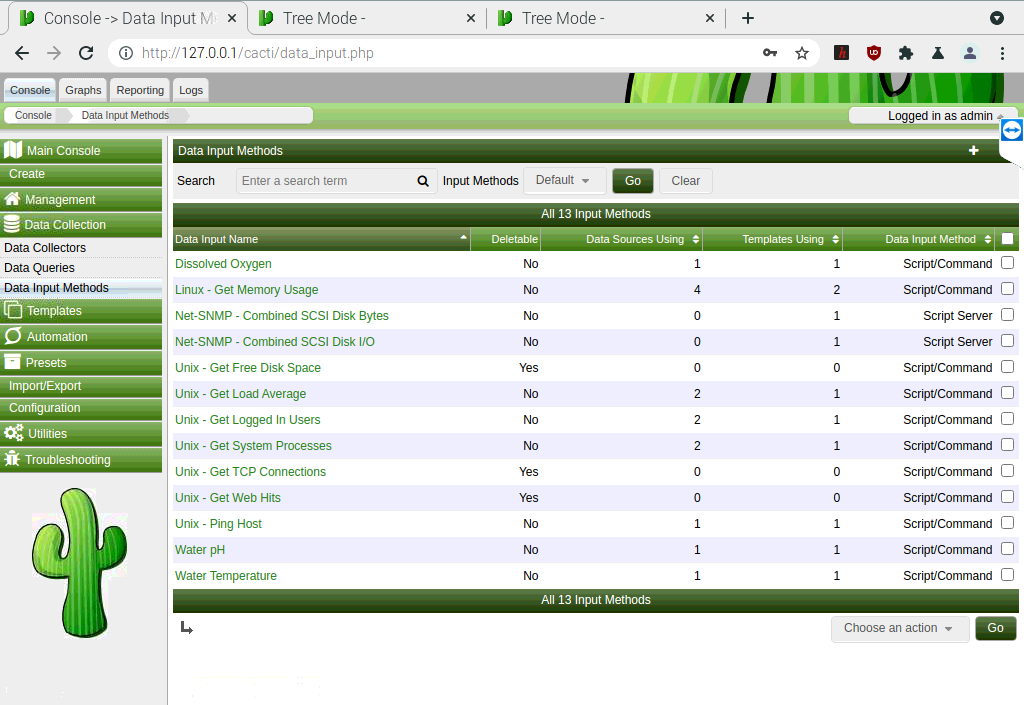
In this example, you can see the three we have created.
The easiest way to create a new Data Input Method is to duplicate an existing one. In our case we used Unix – Ping Host Data Sources Using = 1 and Templates Using = 1, and the Data Input Method = Scripts/Command.

When you go Go, give this duplicate the name of Dissolved Oxygen.
6. Data Input Method
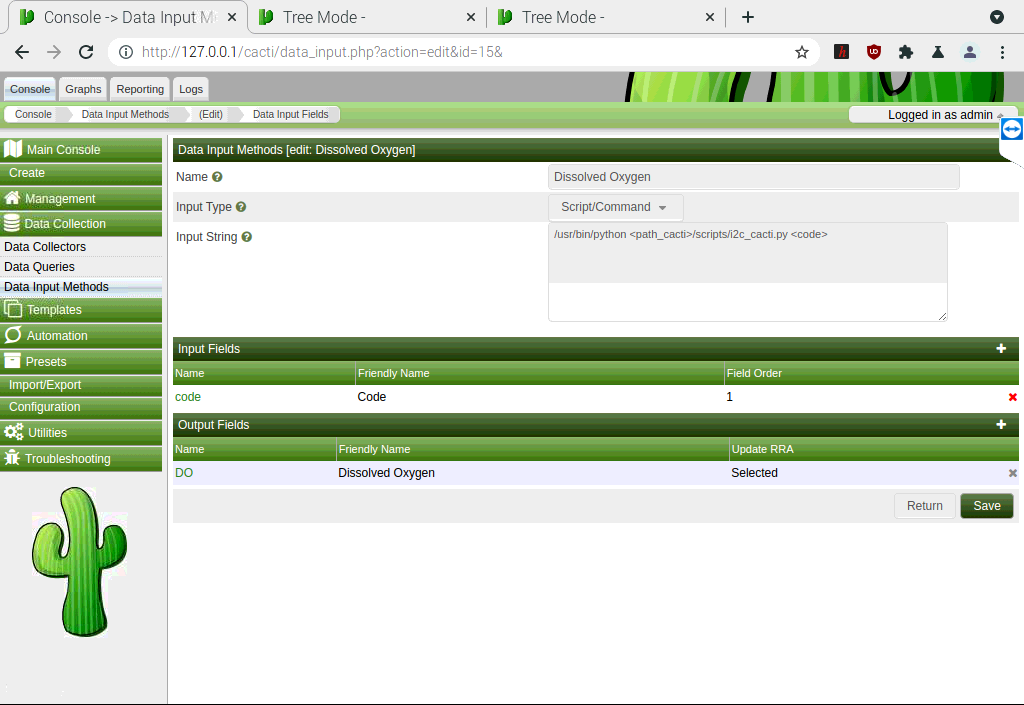
This duplicate now needs:
- A Name: Dissolved Oxygen
- Input Type: leave it at Script/Command
- Input String: This is the secret sauce, and we will get into this more a bit later. For now we need
/usr/bin/python <path_cacti>/scripts/i2c_cacti.py <code>
- For this first part, now Click Save.
Input Field: You will have to delete the existing Input Field by clicking on the red x, then click the plus to create a new one.
This is what you will want here.

Click Save
Output Fields: You will have to delete the existing Input Field by clicking on the red x, then click the plus to create a new one.
This is what you will want here.

7. Templates, Data Source
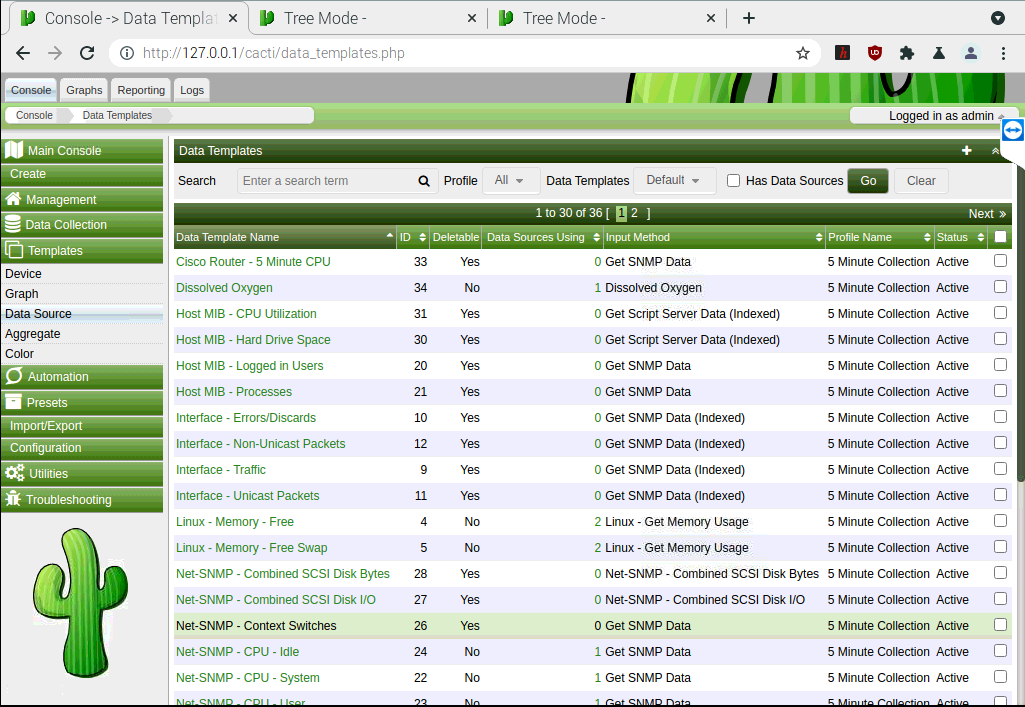
We now need a place to store the Data we are collecting.
The easiest way to create a new Data Input Method is to duplicate an existing one. In our case, we used Unix – Ping Host, which may be on the second page.
Put a tick in its box, click Go, and rename this to Dissolved Oxygen.
You will now need to edit the various fields.
8. New Data Source
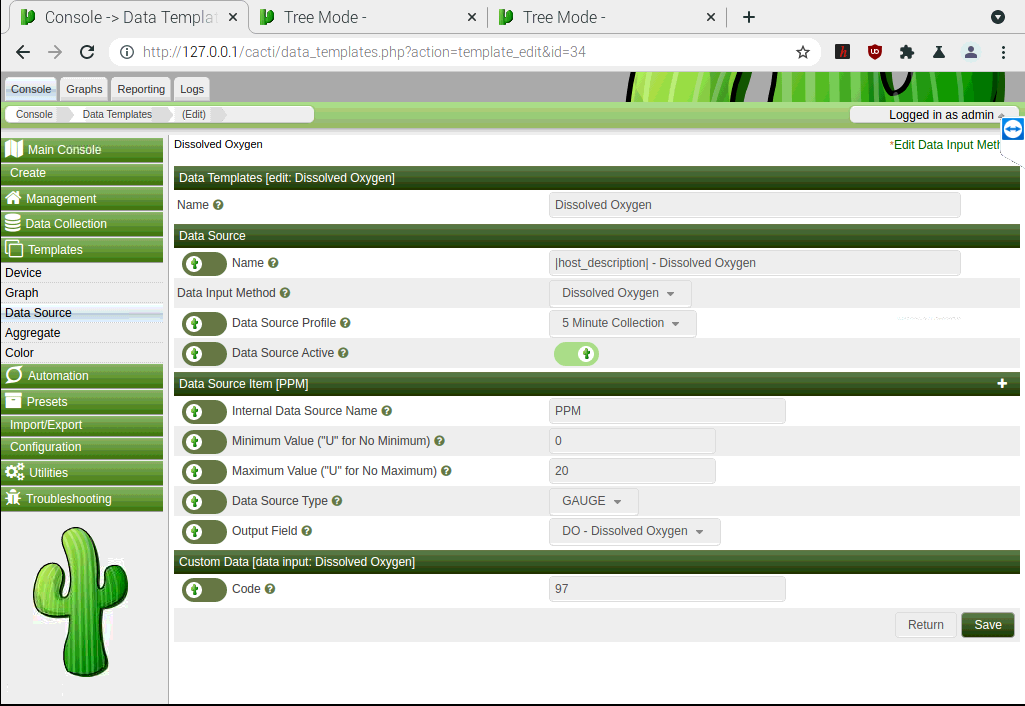
- Name: Dissolved Oxygen
- Name: |host_description| – Dissolved Oxygen, this makes the map more meaningful.
- Data Input Method: Choose Dissolved Oxygen, that we have just previously created.
- Data Source Profile: % Minute Collection.
- Data Source Active: On
- Data Source Item: Change to
- Internal Data Source Name: PPM
- Minimum Value: 0
- Maximum Value: 20, we will never have a number of 10 or so unless there is an error.
- Data Source Type: GAUGE, what the probe says is what we record.
- Output Field: We may have to save the setup first to then see the DO Field that we have previously created.
- Code: 97, this is something we know from what we will be looking at later.
9. Templates, Graph
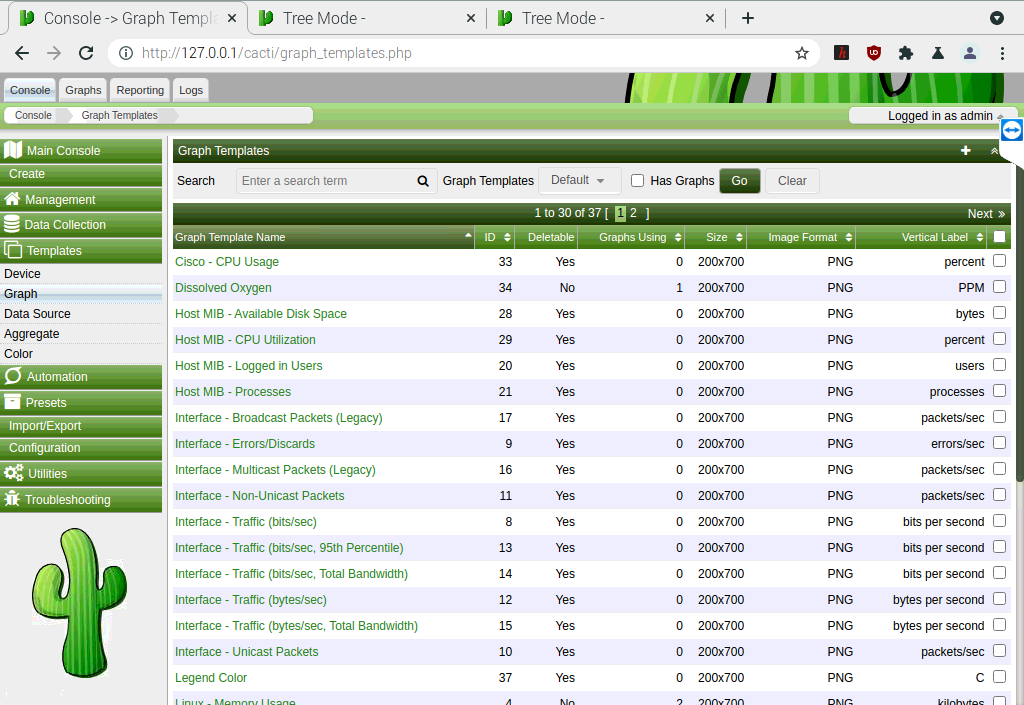
We now need a Graph to show the Data we have been storing.
The easiest way to create a new Graph is to duplicate an existing one. In our case, we used Unix – Ping Latency, which may be on the second page.
Put a tick in its box, click Go, and rename this to Dissolved Oxygen.
You will now need to edit the various fields.
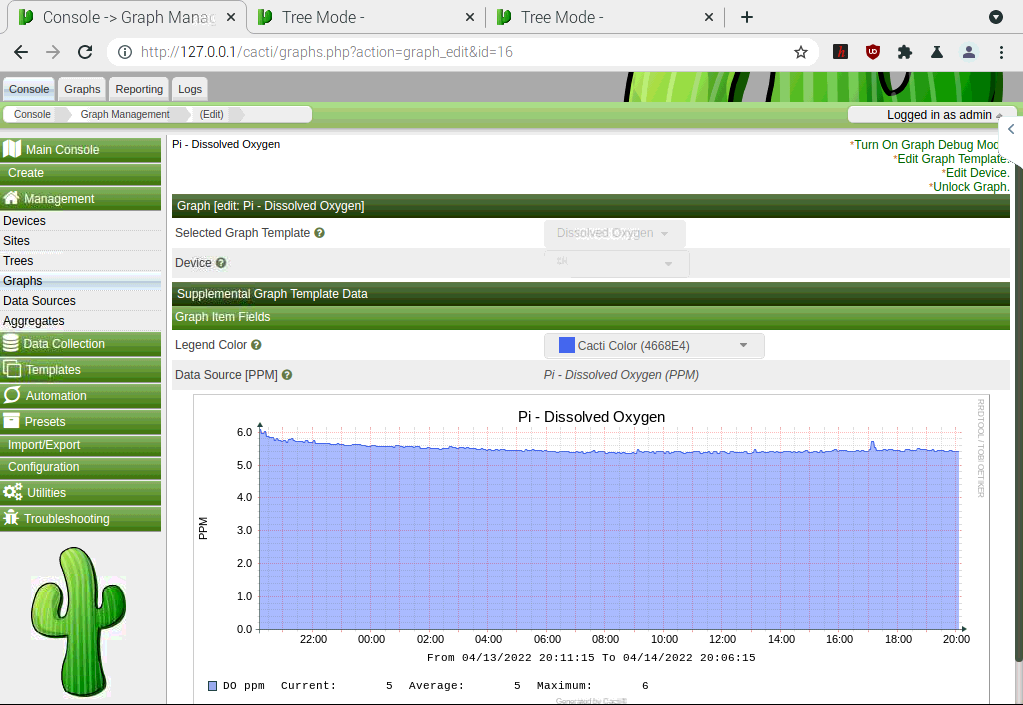
10. New Graph
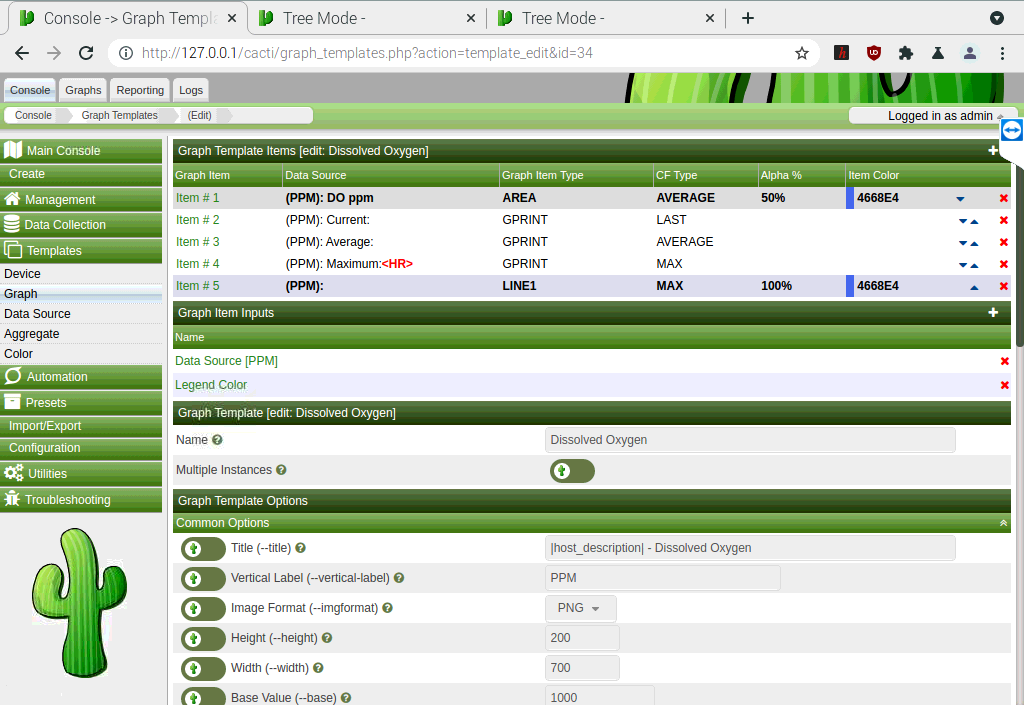
This is a bit involved.
- Graph Template Items
These are the parts of the graph.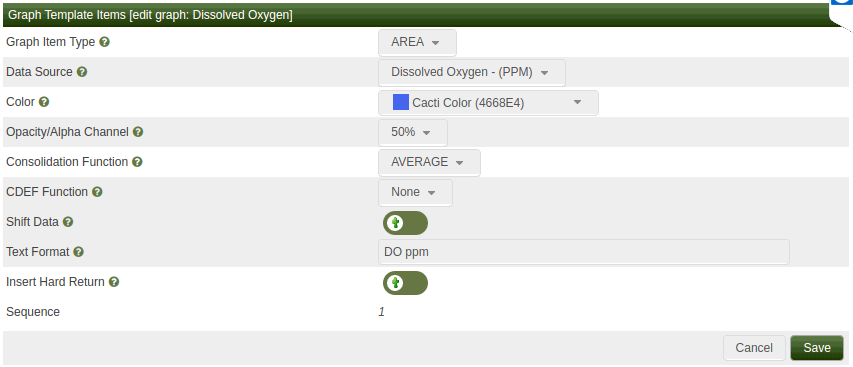
- Item 1
- (PPM): DO ppm
- AREA
- AVERAGE
- 50%
- 4668E4
- Save
- Now do Item 2 – 5 as seen in the main picture.
- Item 1
- Graph Item Inputs.
You will have to delete the existing Input Field by clicking on the red x, then click the plus to create a new one.
Data Source [PPM]
Legend Color
- Graph Template [edit: Dissolved Oxygen]
Make sure this reflects correctly for Dissolved Oxygen.
- Graph template Options
Generally, you can leave this long next section alone.
11. Create Graph
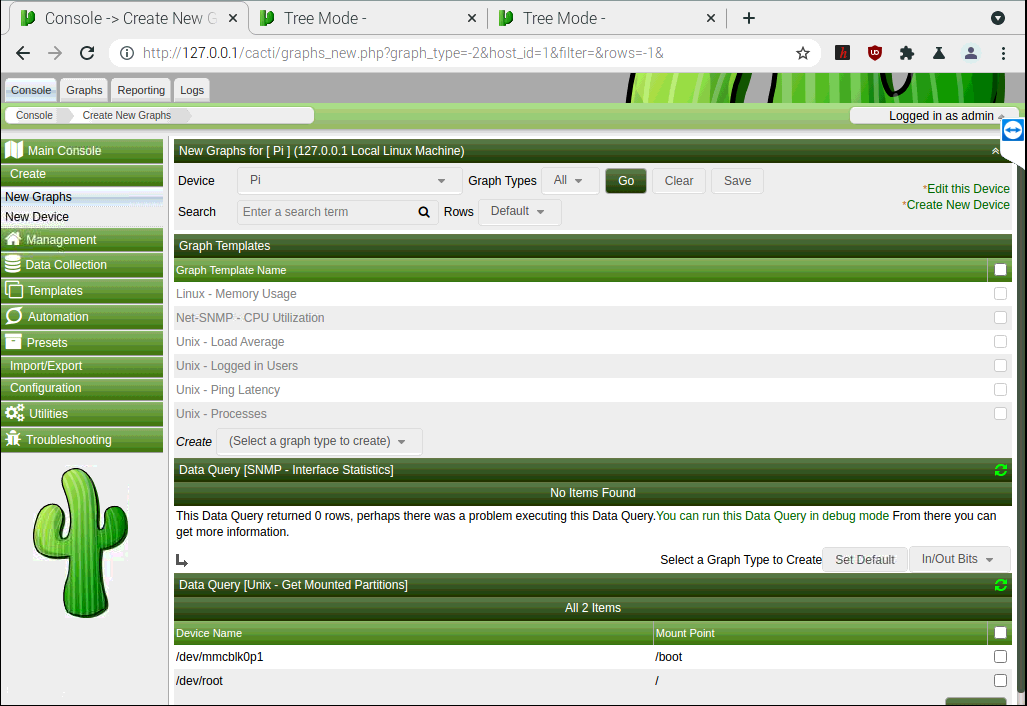
With all the bits created, we can now create a new graph.
- We are in the correct device, you should only have one, the Raspberry Pi.
- In the middle of the screen you have a Create Dropdown box, in here you should find Dissolved Oxygen.
- Select this.
- Put a tick at the top on the green line Graph Template Name.
- With nothing else ticked, click on create.
- You get to choose a color, but leave it at the default.
- Click on Create
You now have a new graph, but we are yet to have a way to actually get data in to it.
12. Python
Once we have set up the Cacti side we need the python side to give us a number when we query the probes.
The following script needs to be put in this directory, /usr/share/cacti/site/scripts/i2c_cacti.py, and called i2c_cacti.py
#!/usr/bin/python

import io
import sys
import fcntl
import time
import copy
import string
from AtlasI2C import (
	 AtlasI2C
)

def print_devices(device_list, device):
    for i in device_list:
        if(i == device):
            print("--> " + i.get_device_info())
        else:
            print(" - " + i.get_device_info())
    #print("")

def get_devices():
    device = AtlasI2C()
    device_address_list = device.list_i2c_devices()
    device_list = []

    for i in device_address_list:
        device.set_i2c_address(i)
        response = device.query("I")
        moduletype = response.split(",")[1]
        response = device.query("name,?").split(",")[1]
        device_list.append(AtlasI2C(address = i, moduletype = moduletype, name = response))
    return device_list


def main():

    device_list = get_devices()

    device = device_list[0]

    #print_devices(device_list, device)
    # Only uncomment in testing

    real_raw_input = vars(__builtins__).get('raw_input', input)

    if len(sys.argv) < 2:         user_cmd = "ALL:r"         cmd_list = user_cmd.split(":")         for dev in device_list:             dev.write(cmd_list[1])         # figure out how long to wait before reading the response         timeout = device_list[0].get_command_timeout(cmd_list[1].strip())         # if we dont have a timeout, dont try to read, since it means we issued a sleep command         if(timeout):             time.sleep(timeout)             for dev in device_list:                 print(dev.read())     else:         user_cmd = sys.argv[1]+":r"         try:             cmd_list = user_cmd.split(":")             if(len(cmd_list) > 1):
                addr = cmd_list[0]
                # go through the devices to figure out if its available
                # and swith to it if it is
                switched = False
                for i in device_list:
                    if(i.address == int(addr)):
                        device = i
                        switched = True
                if(switched):
                    aReturn = device.query(cmd_list[1]).split(":")
                    #print(device.query(cmd_list[1]))
                    aReturn[1] = aReturn[1].replace(" ", "")
                    #print aReturn[1],
                    sys.stdout.write(aReturn[1])
                else:
                    print("No device found at address " + addr)
            else:
                # if no address change, just send the command to the device
                print(device.query(user_cmd))
        except IOError:
            print("Query failed \n - Address may be invalid, use list command to see available addresses")

if __name__ == '__main__':
main() |
sudo apt-get install emacs |
emacs -nw /usr/share/cacti/site/scripts/i2c_cacti.py |
When you run /usr/share/cacti/site/scripts/i2c_cacti.py you get the following:
Success DO 97 : 7.93 Success pH 99 : 3.636 Success RTD 102 TempProbe: 26.068 |
/usr/share/cacti/site/scripts/i2c_cacti.py 97 Gives you 7.93 With no new line |
sudo apt-get install emacs/usr/share/cacti/site/scripts/i2c_cacti.py
When it is not Working

Things to look for when the probe does not work.
If the probe gives a reading manually but not in Cacti, you may be missing permission. This can be seen if you tail “/var/log/cacti/cacti_stderr.log”.
tail -f /var/log/cacti/cacti_stderr.log PermissionError: [Errno 13] Permission denied: '/dev/i2c-1' |
Group Permissions need to be edited. Edit /etc/group so www-data has the group rights of i2c.
i2c:x:998:pi,www-data |
The Group ID Number (998) for i2c could be different on your Raspberry Pi.


